


Typical Meteorological Year
Download a statistically representative “typical year” file built from 15 + years of satellite data for long-term yield modelling.
IRRADIANCE , WIND AND WEATHER DATA
Power Forecasting Models
Insights
Validations
IRRADIANCE AND WEATHER DATA
Historical Time Series
Typical Meteorological Year
Live Data
Forecast Data
POWER FORECASTING MODELS
DNV GREEN DATA PRODUCTS
Solcast is independently validated as the lowest uncertainty solar resource dataset
Meteonorm is a long-running commercial source of lower quality, lower cost irradiance data with a focus on the use of measurement data, supplemented with interpolation from satellite data. Compared with Meteonorm, Solcast is bankable, has lower uncertainty, has more data features, and is more open and easier to integrate with.
Meteonorm is a Windows software application, API, DLL and associated database made available by Swiss weather company Meteotest. Users install the application, purchase annual licenses, and download data from the application, API or DLL. Meteonorm has primarily focused on aggregation and extrapolation of surface measurements of varying quality, and provides data globally at 5-7km, with high resolution data available in some regions.
Meteonorm and Solcast both provide global irradiance and weather data, but are very different offerings.
Solcast data is bankable, and has an API for both Timeseries and TMY with open documentation. Meteonorm tends to be cheaper overall with different offerings.
Meteonorm provides free demo-mode access to their software, with data available for 5 pre-selected locations. Solcast provides instant online and API access to 8 unmetered locations, and free evaluation access to forecast and historical data through commercial accounts in the Solcast Toolkit.
Solcast | Meteonorm | |
|---|---|---|
Bankable? | | |
Free online trial with instant access and data download? | | |
Comprehensive, global, validation study | 207 Sites | 83 sites |
Finest time resolution of satellite-based irradiance | 5 minutes | 60 minutes |
Real time data available? | | |
| |
Source: Meteonorm Handbook part I: Software & Meteonorm Handbook part II: Theory
Meteonorm uses a fundamentally different way to model the solar resource, based on interpolation of station data as a leading driver, and synthetic TMY generation. Constructing a global database using weather stations is challenging, due to data quality issues with the measurements (siting, calibration, cleaning, etc), and the uneven geographic distribution of stations. Clouds and irradiance have poor spatial autocorrelation, which is why things can change markedly in as little as 5 to 10km away from the closest surface measurement site, sometimes even less.
Meteonorm has supplemented its database with satellite data, however this has been done using only 10-15 minute inputs (compared to 5 to 15 minutes for Solcast and Solargis). The most granular solar resource data used by Meteonorm from 430 weather stations and other sources is monthly averages, using these to statistically generate TMY hourly values. This synthetic generation of a typical year dataset results in loss of the coherence between solar irradiance and air temperature. As the performance of solar power systems varies with solar irradiance and air temperature, use of synthetic hourly dataset increases the uncertainty of solar energy simulations.
Meteonorm and Solcast are both independently validated, globally, Meteonorm at 85 sites and Solcast at 207 sites. Whilst independent studies are not directly comparable, Solcast significantly outperforms Meteonorm on all accuracy measures, by a large margin, across GHI and DNI, and across bias spread and RMSE.
Solcast | Meteonorm | |
|---|---|---|
Performed by | DNV | IEA PVPS |
Year published | 2023 | 2023 |
No. of sites | 207 | 85 |
Mean Bias | +0.33% | -0.67% |
Bias Std. Dev. | ±2.47% | ±6.99% |
80% CI Bias (10% to 90%) | -2.84% to 3.50% | -9.63% to +8.29% |
90% CI Bias (5% to 95%) | -3.74% to 4.40% | -12.17% to +10.83% |
Mean nMAD (nMAE) | 10.33% | 12.55% |
Std. Dev. nMAD (nMAE) | ±3.72% | ±3.88% |
Mean nRMSD (nRMSE) | 15.99% | 17.80% |
Std. Dev. nRMSD (nRMSE) | ±5.74% | ±5.56% |
Solcast | Meteonorm | |
|---|---|---|
Performed by | DNV | IEA PVPS |
Year published | 2023 | 2023 |
No. of sites | 117 | 85 |
Mean Bias | +1.50% | +0.27% |
Bias Std. Dev. | ±5.75% | ±15.61% |
80% CI Bias (10% to 90%) | -5.87% to 8.86% | -19.74% to +20.28% |
90% CI Bias (5% to 95%) | -7.96% to 10.95% | -25.40% to +25.94% |
Mean nMAD (nMAE) | 19.97% | 27.76% |
Std. Dev. nMAD (nMAE) | ±5.94% | ±7.42% |
Mean nRMSD (nRMSE) | 31.51% | 38.11% |
Std. Dev. nRMSD (nRMSE) | ±9.99% | ±10.28% |
Forstinger, A., et al. (2023). Worldwide benchmark of modelled solar irradiance data (2023 PVPS Task 16): Solar resource for high penetration and large-scale applications. ResearchGate.
Cuevas-Agulló, E., et al. (2023). A new global high-resolution solar resource dataset. Zenodo.

Download a statistically representative “typical year” file built from 15 + years of satellite data for long-term yield modelling.
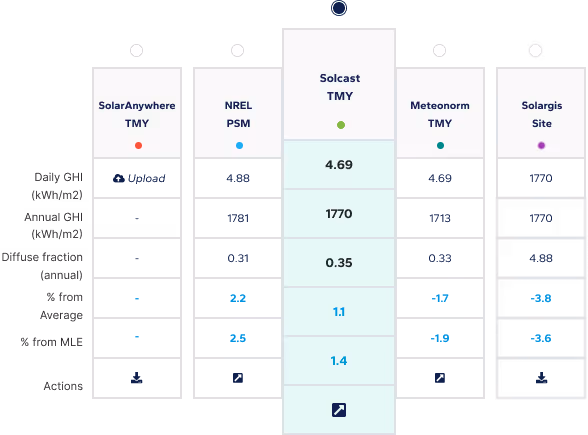
Compare multiple satellite data sets side-by-side to choose the most bankable resource file for your site.
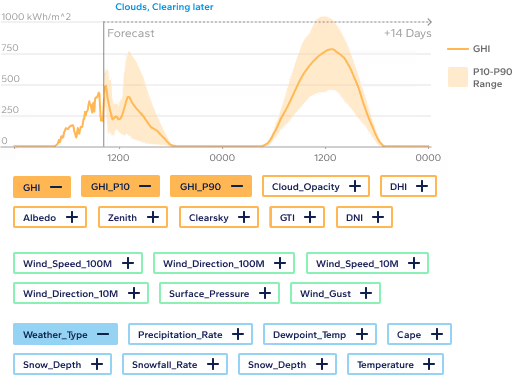
Access industry-leading solar forecasts up to 14 days ahead, combining satellite nowcasting and weather models for precision energy planning.
Subscribe to our newsletter to keep up to date with all the latest news.
Subscribe to our newsletter to keep up to date with all the latest news.