


Typical Meteorological Year
Download a statistically representative “typical year” file built from 15 + years of satellite data for long-term yield modelling.
Overview of validation approach
Solar Resource Compass (SRC) is built on a robust foundation of technical methodologies that ensure trustworthy, bankable outputs. Every irradiance selection, yield estimate, and modeling assumption within SRC is grounded in validated, published methods used across DNV’s independent engineering and due diligence practices.
This page provides transparency into the core methods underpinning SRC’s outputs, supported by both empirical validation and peer-reviewed research. It distinguishes between foundational methodologies, which are explained in detail, and supporting models, which are summarized and linked to relevant reference materials.
Selecting a long-term representative irradiance dataset is a foundational challenge in solar energy assessment. SRC employs Maximum Likelihood Estimation (MLE) to objectively determine which dataset most accurately reflects the long-term solar resource at a given site.
Rather than choosing a single satellite dataset or relying on averages, MLE evaluates each available source based on its reported uncertainty (normalized to a 95% confidence interval). It then combines the probability distributions of the datasets to identify the irradiance value with the highest cumulative likelihood.
Example: Site Alpha | ||
|---|---|---|
Source | Expected GHI (kWh/m2/year) | Uncertainty (%) |
A | 2190 | 7 |
B | 2210 | 7 |
C (MCP) | 2400 | 3 |
Using MLE, the final GHI estimate is skewed toward Source C due to its lower uncertainty, even though Sources A and B have similar values.
Example: Site Beta | ||
|---|---|---|
Source | Expected GHI (kWh/m2/year) | Uncertainty (%) |
MCP-adjusted TMY | 2162 | 3.3 |
Satellite Vendors A–D TMY | 2091–2166 | 4.0–7.0 |
NSRDB TMY2 / TMY3 / PSM | 2090–2138 | 5.6–7.0 |
For Site Beta, MLE selected NSRDB TMY2 as the nearest match, but the method also yielded a small boost to the GHI estimate based on composite likelihood. The method allows incorporation of multiple data sources while transparently reflecting their uncertainties.
🔗 [Whitepaper – MLE for Solar Resource Selection (IEEE PVSC 48)]
The SolarFarmer engine, used by SRC to model energy yields, has undergone extensive validation against operational performance data from 12 utility-scale PV projects totaling over 800 MW.
Example: Site Beta | ||
|---|---|---|
Metric | PVsyst (2021) | SolarFarmer (2023 Addendum) |
Median Performance Index (PI) | -0.3% | +0.1% |
PI Standard Deviation | 3.2% | 2.3% |
Bifacial Tracker Validation (PI) | −0.7% | Std. Dev. 1.9% |
Adjustments that improved performance alignment included:
🔗 [2021 Solar Assessment Validation – Published 2022]
🔗 [Addendum – Published 2023]
SolarFarmer is regarded as bankable, having supported six comprehensive solar-project financing due-diligence engagements totalling 1,195 MW.
SRC incorporates DNV’s Hourly Modeling Correction (HMC) to reduce bias caused by sub-hourly inverter clipping, especially in systems with high inverter loading ratios (ILR).
Key studies:
🔗 [DNV Solar Whitepaper - HMC Clipping Loss Validation PVSC48 NREL]
🔗 [DNV Solar Whitepaper - HMC Effect of Inverter Loading Ratio on Energy Estimate Bias PVSC49]
🔗 [DNV Solar Whitepaper - HMC Effects-of-satellite-sampling-on-subhourly-modeling-errors PVSC49]
SRC uses a trigonometric geometry-based terrain loss model integrated into SolarFarmer. It calculates cross-axis tilt impacts on trackers due to slope.
🔗 [SolarFarmer Model: Terrain Shading in Tracker Systems]
Monthly snow loss factors are estimated using historical snowfall data combined with loss curves derived from operational field data. SRC’s snow model is based on the Townsend Model, developed using multi-year winter observations from the SIERRA study.
🔗[Townsend et al., Photovoltaics and Snow – SIERRA Study]
SRC uses a regional soiling loss model adapted from the Kimber et al. (2006) dataset, which evaluated performance across 250+ PV systems in California and the U.S. Southwest. The model has been modified by DNV to reflect seasonal patterns and modern datasets.
🔗 [Kimber et al., The Effect of Soiling on Large Grid-Connected PV Systems]
DNV's standard system-level degradation rate is -0.64%/year, based on peer-reviewed fleet studies totaling over 7 GW.
🔗 [Jordan et al., Progress in Photovoltaics, 2022]
Every method integrated into SRC is consistent with DNV’s broader framework for:
This ensures that outputs from SRC are both traceable and defensible during due diligence and lender reviews.
Title / Event | Authors / Contributors | Publication / Date | Focus Area / Key Findings |
|---|---|---|---|
Maximum Likelihood Estimation (MLE) for Solar Resource Selection | Kharait, Nanduri, Synnes, Jacobsen, Ervin | IEEE PVSC 48, 2021 | Irradiance dataset selection using Maximum Likelihood Estimation (MLE) |
Hamer, Previtali, Slouka, Shymko | EU PVSEC, 2020 | Comparison of pre-construction energy models with operational data | |
Neubert, Hamer, Rainey, Mikofski | EU PVSEC, 2021 | Refinements including terrain loss, stow modeling, bifacial, and HMC | |
DNV | DNV, 2023 | Benchmarking Solcast GHI and DNI datasets using ground stations | |
Parikh, Perry, Anderson, Hobbs, Kharait, Mikofski | DNV, 2022 | Sub-hourly clipping correction using ML; validated with SCADA data | |
HMC: Effect of Inverter Loading Ratio on Energy Estimate Bias | Anderson, Hobbs, Holmgren, Perry, Mikofski, Kharait | PVSC 49 | How ILR increases clipping loss error when using hourly data |
HMC: Effects of Satellite Sampling on Sub-Hourly Modeling Errors | Mikofski, Holmgren, Newmiller, Kharait | NREL, 2022 | Impact of satellite data frequency on clipping error |
Jordan, Anderson, Perry, Muller, Deceglie, White, Deline | Prog. Photovoltaics, 2022 | System-level degradation analysis from 7.2 GW of PV systems | |
Townsend, Powers | IEEE PVSC 37, 2011 | Empirical snow loss curves based on multi-year field data | |
Kimber, Mitchell, Nogradi, Wenger | IEEE WCPEC 4, 2006 | Empirical soiling rates from 250+ PV sites in dry climates |

Download a statistically representative “typical year” file built from 15 + years of satellite data for long-term yield modelling.
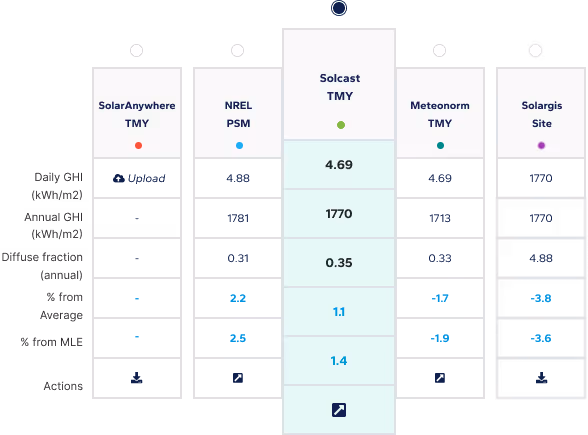
Compare multiple satellite data sets side-by-side to choose the most bankable resource file for your site.
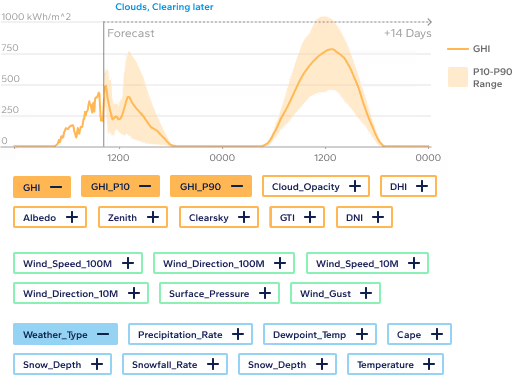
Access industry-leading solar forecasts up to 14 days ahead, combining satellite nowcasting and weather models for precision energy planning.
Subscribe to our newsletter to keep up to date with all the latest news.