








Dr. Hugh Cutcher
September 22, 2026
Share this post
August produced a sharp divide in irradiance conditions across North America, according to analysis using the Solcast API. Global horizontal irradiance (GHI) fell across the Upper Midwest and Great Lakes but rose across the north-west coast and south-central United States and Mexico. Near Dallas, the lack of rain allowed modeled soiling loss to climb towards 2% by the end of the month. Hurricane Lala brought extreme rain to Hawaii, although monthly GHI there was only 4% below normal.
Across much of the Upper Midwest and Great Lakes, GHI was as much as 17% below average. Chicago recorded a 17% negative anomaly, while Toronto was 10% below average and Buffalo was 8% below. Indiana and Ohio both had their wettest August on record. By contrast, GHI was around 10% above average across the south-central United States as Texas and Oklahoma recorded one of their five driest Augusts. Positive anomalies continued through most of Mexico. Much of the Pacific Northwest was around 5% above average, while southern California and the interior West were around 5% below.
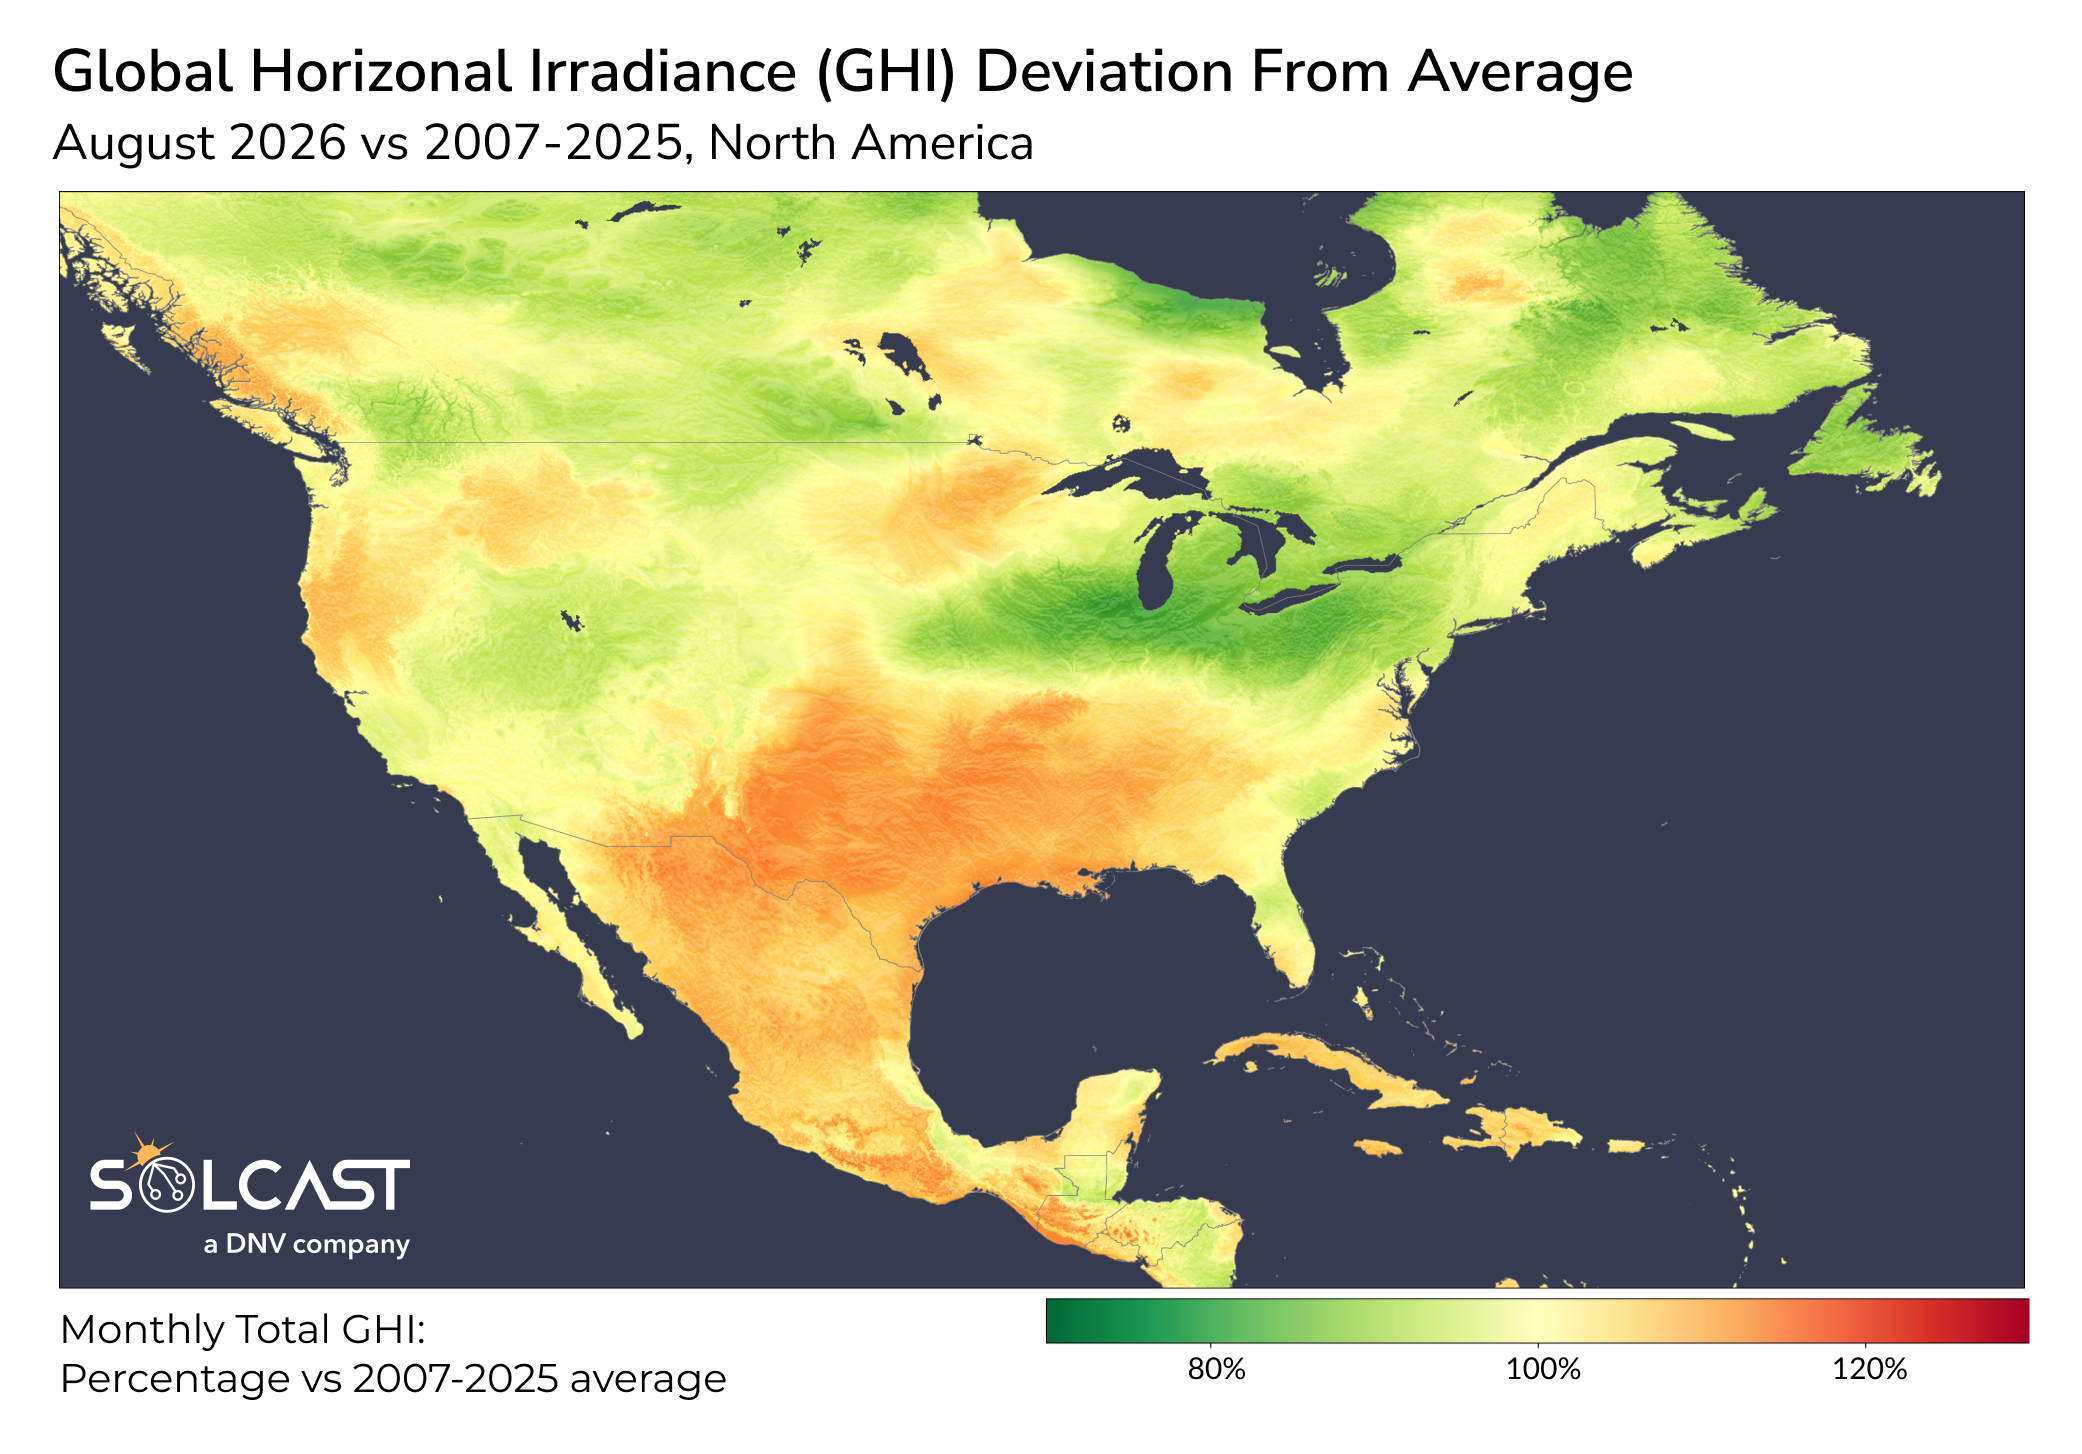
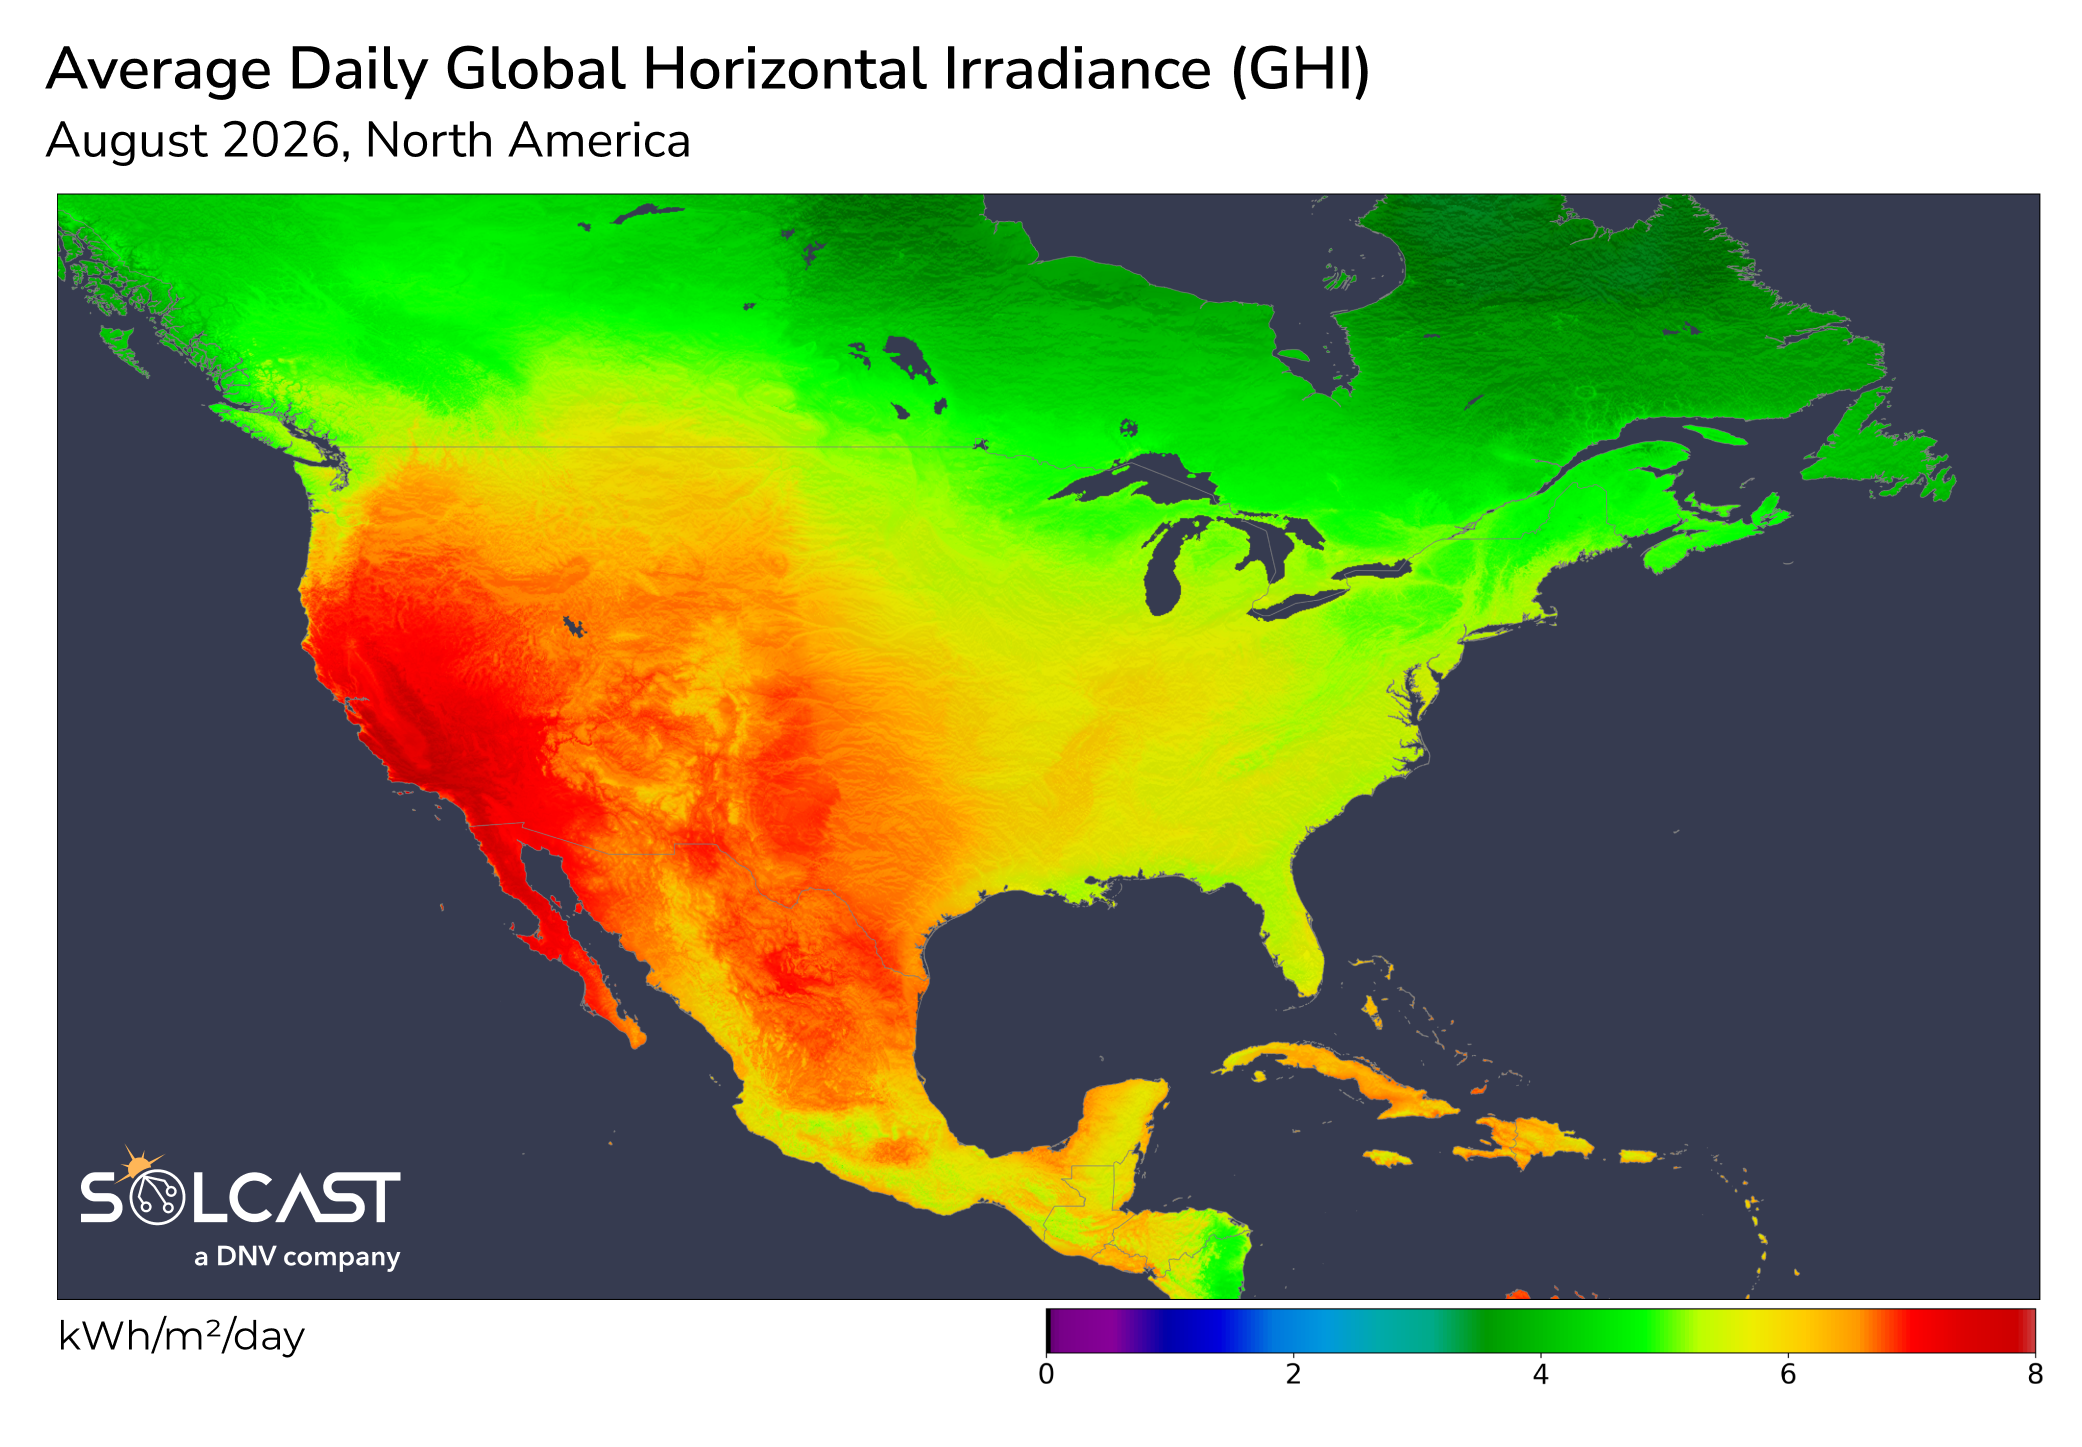
The anomaly map above shows the contrast between the Great Lakes and the south-central United States and Mexico. These anomalies describe departures from each location’s normal August conditions, rather than absolute irradiance. Below shows the distribution of average daily irradiance, highlighting that despite relative underperformance this year, California remains one of the best places in the country for solar resource.
The continental pattern was associated with a persistent, unusually strong high-pressure ridge centred near the Four Corners and a low-pressure anomaly over Ontario. High pressure suppressed cloud formation across the south-central United States, while the Ontario low supported wetter conditions farther north. Most of the United States also recorded a top-10 or record-warm August. Fires continued in the northwestern United States and British Columbia. Analysis with the Solcast API shows that smoke reduced August GHI by 1–2% across the Northwest and downwind into the north-central United States.
Near Dallas, modeled soiling loss rose towards 2% by the end of August, the highest late-August value in the 2007–2026 series. The increase primarily reflected the absence of rainfall to wash accumulated material from modules, rather than unusually high deposition rates. June soiling was slightly below average and July was above average. August then reached a record high. Across the full June-to-August period, 2026 ranked as the second-highest soiling season on record.
Frequent rains in June kept 2026 soiling close to zero early in summer, then a long dry period allows soiling losses for unwashed panels to rise continuously from mid-July through the end of August.
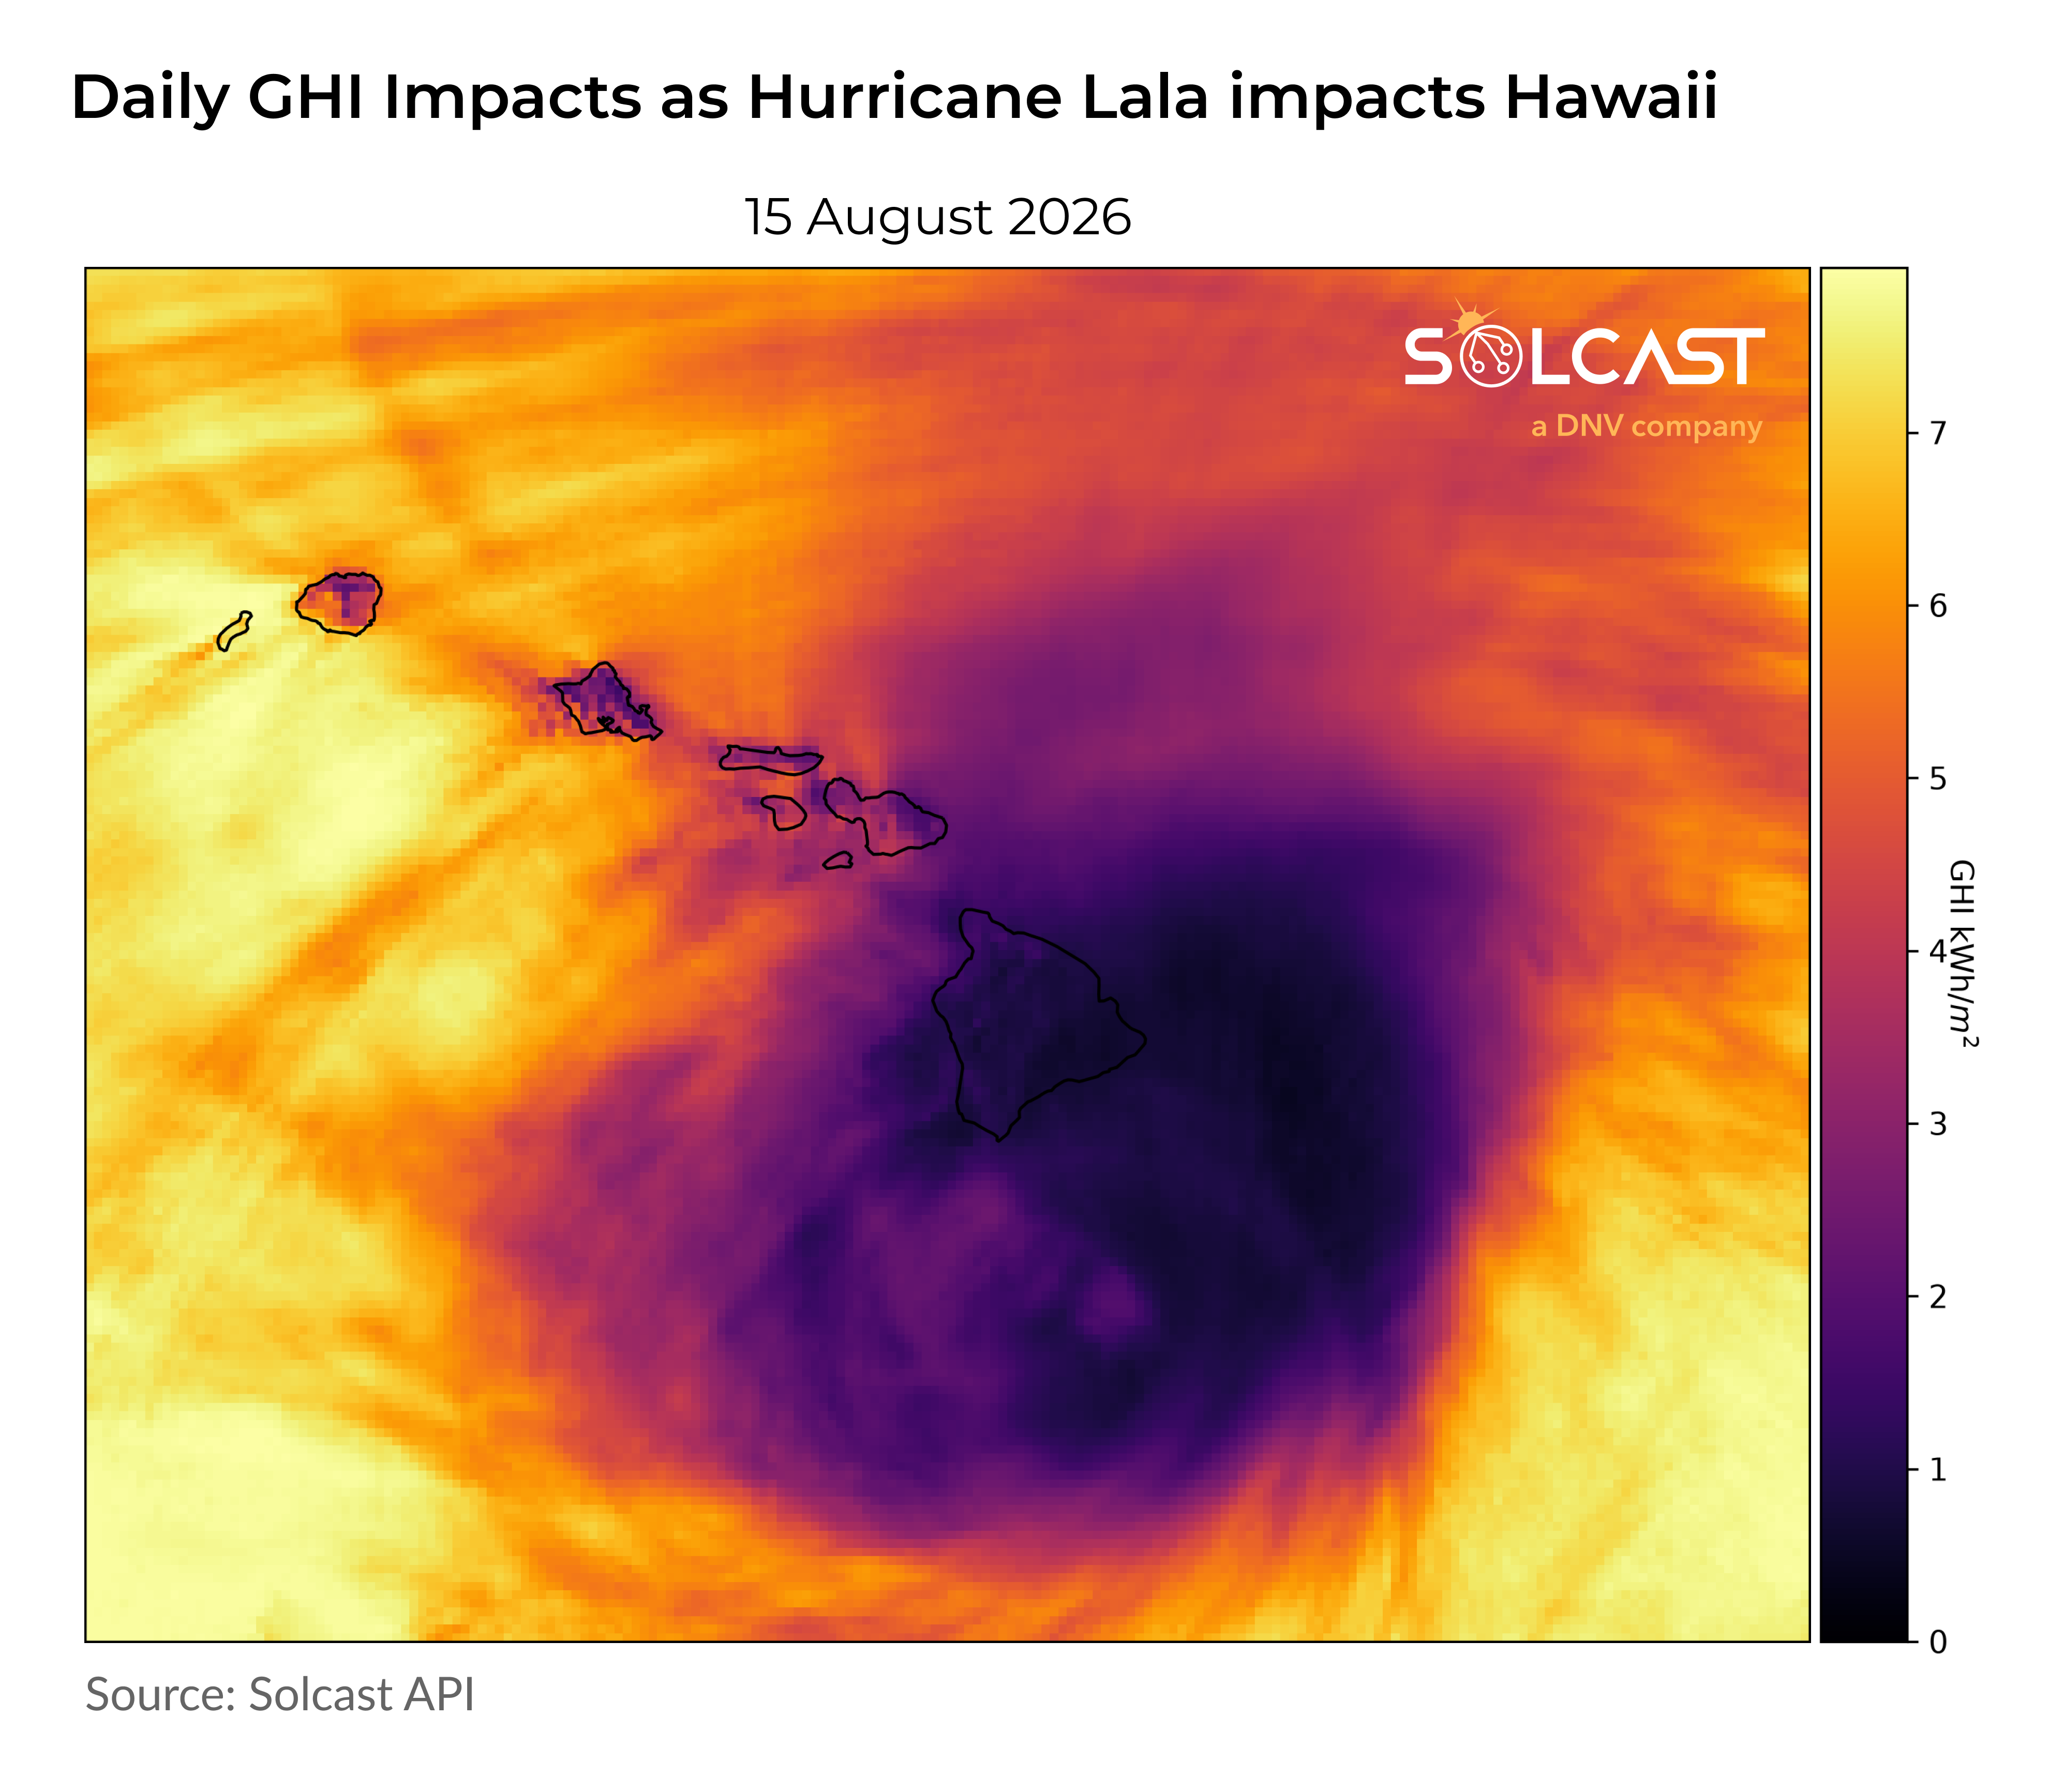
Hurricane Lala made Hawaii’s first direct hurricane landfall since 1992. Wind gusts reached 90 mph, while flooding brought more than 30 inches of rain, damaged roads and houses, and caused widespread power outages. Hawaii received more than 200% of its average August precipitation, but as the storm only impacted a few days, monthly GHI averaged only 4% below normal. The islands also recorded their third-warmest August in 37 years. Cyclone activity was well above average in the eastern and central Pacific during August but below average in the Atlantic. This distribution was consistent with the strengthening El Niño pattern, which provided warmer Pacific waters to support hurricanes while typically suppressing Atlantic activity.
Track weather conditions, cloud movements, and irradiance-influencing factors that might impact your solar generation. Access bankable actuals and accurate forecasts when you sign up for a Solcast API toolkit. You can reach out to our team for an extended trial.